Infographics
SEARCH
CATEGORIES
TAGS
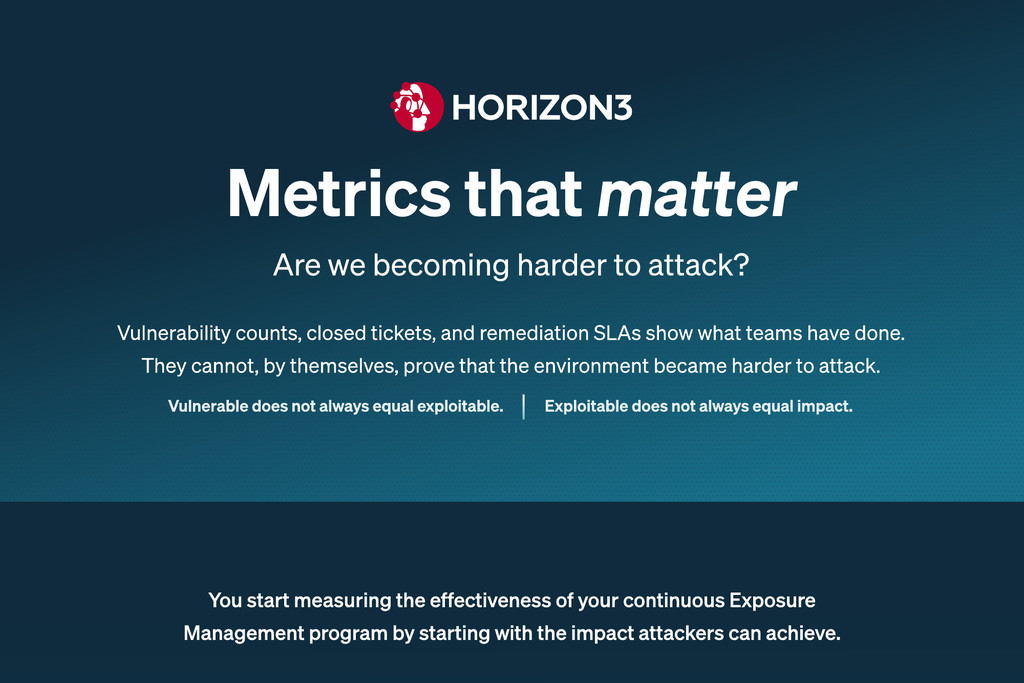
Metrics That Matter: Are We Becoming Harder to Attack?
November 8, 2026
Closed tickets and remediation SLAs show what teams have done, not whether the environment is harder to attack. This infographic outlines four Exposure Management metrics: attack paths and impacts, speed of impact reduction, verification coverage, and recurrence.
CTEM: From Visibility to Measurable Risk Reduction
August 19, 2026
Learn how to operationalize CTEM as a continuous cycle that validates exploitable risk, prioritizes what matters, verifies remediation, and drives measurable risk reduction.

Key Insights from Over 50,000 NodeZero® Pentests Infographic
April 10, 2025
Key findings from Horizon3’s Annual Insights Report, powered by NodeZero® data and a survey of 800+ CISOs and IT pros.

Securing Financial Services: 5 Critical Cybersecurity Advantages of NodeZero
January 3, 2025
Discover 5 key cybersecurity advantages of NodeZero™ for financial services: executive insights, fraud protection, compliance cost reduction, and more.

8 Steps for Enhancing Cybersecurity Post-Breach
October 1, 2024
A 8-step guide to strengthening cybersecurity post-breach with autonomous pentesting and continuous risk assessment using NodeZero.

The Total Economic Impact™ Of The NodeZero™ Platform Infographic
January 10, 2024
The NodeZero® platform helps organizations improve SecOps productivity and save on third-party pentest & vulnerability scanner costs. Learn how in the commissioned Forrester Consulting Total Economic Impact™ study. Download the Study

